Johns Hopkins APL Technical Digest
Using Knowledge Graphs to Counter Weapons of Mass Destruction

Ray H. Mariner, Timothy P. Lippa, Phillip T. Koshute, David W. Boyce, Josef C. Behling, and Michael J. Peters
Abstract
This article describes the development of a data-driven approach to map adversarial activity into machine-readable models. Specifically, this approach is grounded in well-structured knowledge graphs and uses a semantic representation of domain-specific pathways implementing formal ontology and Resource Description Framework (RDF) and Web Ontology Language (OWL). In addition, the article describes a web-based application through which a user can interact with the underlying knowledge graph. The application also allows for development of analytics that use these data to answer questions about adversarial activity.
Download this article or scroll to continue reading
Introduction
Many US government agencies and organizations are involved in countering weapons of mass destruction (CWMD). While overall goals and specific mission objectives vary, the US government typically requires access to experts on WMD production. When experts are not readily available, however, especially in operational settings, the government has typically supplemented expert knowledge with printed material, such as note cards or books. In a field environment, these printed materials can be cumbersome to carry and use effectively, especially for new operators. Additionally, materials are often severely outdated because adversaries have evolved their tactics, techniques, and procedures (TTPs).
Another factor complicating CWMD missions is the lack of a common vocabulary to describe adversary TTPs. This, coupled with the many disparate and stovepiped data systems, makes sharing information difficult. As a result, everything from retrieving information to developing advanced artificial intelligence and machine learning algorithms is inefficient and costly. APL recognized the potential of semantic data models to enable a revolutionary shift in CWMD knowledge management and analysis.
Based on an Independent Research and Development experiment, APL researchers developed a semantic data model using domain-specific ontologies. Without ontologies, analysts typically rely on the natural language to describe the world, and natural language lacks the precision required for machine interpretation. The formal representation of knowledge through ontologies allows for greater clarity among both individuals and computer agents. For instance, consider the difficulty a system (or human) would face in understanding the intent of the word tank in the following example: “Tanks found at grid coordinates x,y, along with heavy-duty press and several kilograms of calcium chloride.” Because natural language is inherently overloaded, this one simple example quickly grows in confusion when attempting to describe and model a domain of interest in any detail. To address the associated problems described above for supporting CWMD missions, APL developed several domain-specific ontologies to define and represent the relationships between entities within the field of WMD agent production.
Existing US Department of Defense and Intelligence Community systems provide information (e.g., observations of entities and events of interest). APL’s semantic models allow us to organize and relate this information, and the organization and relationships then allow us to reliably interpret the information and build analytical tools.
In 2009, the US Defense Threat Reduction Agency (DTRA) funded the creation of a broader set of CWMD adversary models in pursuit of the following objectives:
- Characterize threats with meaningful definitions, health and safety information, and physical properties
- Identify and document adversary TTPs for WMD production, weaponization, and employment
- Provide a standard vocabulary for CWMD missions
- Provide analytical capabilities to aid analysts looking for WMD activity
APL, on behalf of DTRA, created these models and developed a comprehensive knowledge graph known as the Chemical, Biological, Radiological, Nuclear, Explosive Semantic Framework (CBRNE-SF). This graph contains the information related to processes (actions taken by an adversary) and observables (things needed and used by an adversary) to perform a specific action in pursuit of WMD. Pathways for more than 100 threat agents have been modeled, with more than 20,000 observables and more than 100,000 multilingual alternative labels and synonyms for the observables.
A simple example is presented in Figure 1. The activities are represented by rectangles, whereas observables are in blue type beneath each activity. If someone had made fresh orange juice, one could expect to observe oranges, a juicer, and a pitcher.
Powered by the CBRNE-SF, APL also created a user interface for DTRA, which is currently deployed in several environments across many federal agencies. The application allows the user, or even other systems, to access the CBRNE-SF to quickly complete the following tasks:
- Identify observables using a comprehensive list of synonyms and imagery for WMD agents, precursors, and equipment to help standardize the vocabulary used to describe WMD TTPs
- Understand how observables are associated with adversary activities related to WMD production, weaponization, and employment
- Understand health and hazard information on the effects of WMD agents and precursors, including chemical exposure, biological disease, and symptoms
Figure 1
Example of the process of making fresh orange juice. Observables are listed below each boxed activity.

CBRNE-SF Construction
The CBRNE-SF knowledge base contains the interconnected series of actions an adversary would likely take when producing, weaponizing, or employing a WMD. In many cases, there are several different synthetic approaches to produce a WMD, so the knowledge base must contain all possible approaches. The knowledge base is not meant to provide precise step-by-step instructions for producing, weaponizing, or employing a WMD; instead, it provides a road map to the most essential actions that present opportunities for discovery. Additionally, it leverages a diverse range of authoritative sources. Subject-matter experts (SMEs) consulted online databases, specialized dictionaries, reference texts, peer-reviewed journals, and other trusted resources to develop each process. Whenever possible, our workflows are grounded in, and enriched by, peer-reviewed literature.
To codify the steps an adversary would use to carry out some activity or set of activities, we developed the following lexical constructs: pathways, processes, activities, observables, and signatures.
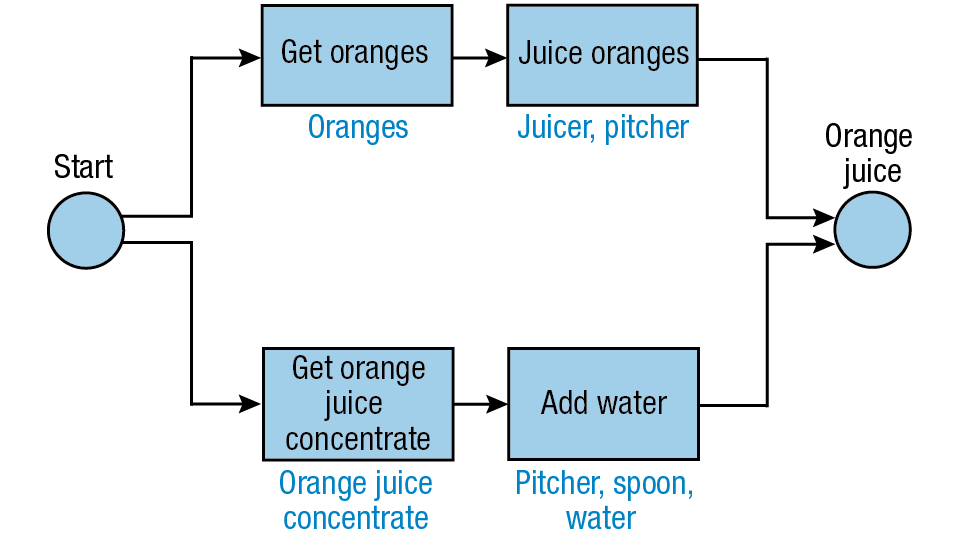
A pathway is the interconnected series of actions that are performed and lead to some intended outcome. In CBRNE-SF, this takes the form of a unidirectional flowchart comprising processes and activities.
A process allows for collecting related activities used to get to a specific end state. These processes can be nested as subprocesses in a bigger overall process.
An activity defines the lowest level of discrete action modeled in the pathway. Activities contain all the relevant information required for that activity to be completed successfully and, subsequently, all the information that would allow the activity’s discovery. These activities are assembled in processes that themselves can be nested in higher-level processes. Similar to Unified Modeling Language (UML),1 we provide constructs in the data model that allow for decisions to be made when multiple choices are available in carrying out a set of activities and also allow capture of activities that can be performed asynchronously. Supplemental information, such as activity descriptions, references, drawings, and illustrations, is also captured and associated as appropriate. Within the CBRNE-SF, processes and activities can be reused to gain efficiency in modeling new threats. A SME can leverage these previously modeled items containing hundreds or thousands of nodes simply by copying them. This saves considerable time and standardizes the processes for commonly used precursors, as well as allows for quick updates to the models as the threat landscape changes.
A key innovation for the construction of the data model is the idea that the pathways themselves should be instantiations of ontological classes. This led to the development of a pathway modeling ontology, with the resulting behavior that, as the pathways are constructed, the processes, activities, decisions, etc., end up as connected nodes in the knowledge graph. This allows for a fully interconnected graph that can be easily traversed in a query. This enables the kinds of analysis described later in this article.
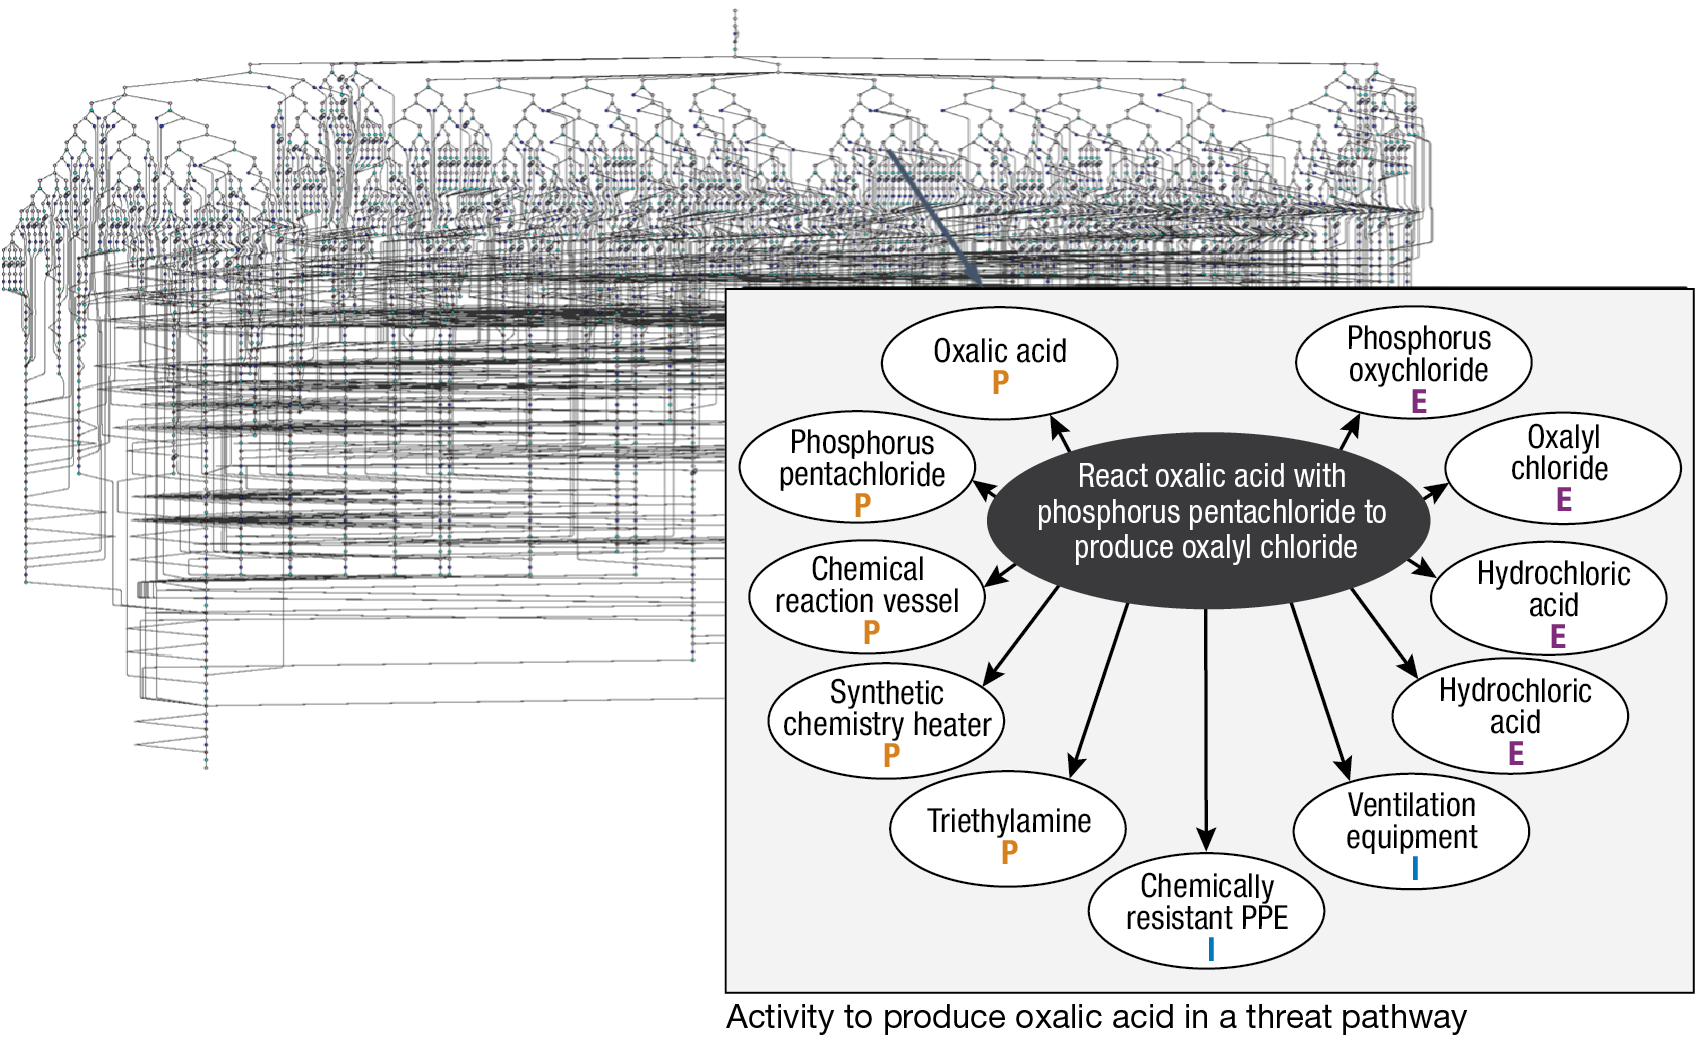
A pathway allows for activities to be associated with the set of items, or observables, required to carry out the activity successfully, and each of these observables in turn can be associated with many signatures (e.g. spectral). These signatures are data representations of how the observable “appear” when analyzed by a specific sensor.
Here, similar to the construction of the pathways, each association of an observable to an activity or signature to observable, expands the knowledge graph by creating additional nodes and edges in the data model.
Observables can most simply be thought of as anything that can be sensed (e.g., smelled, tasted, seen, heard, touched). Observables are divided into three distinct groups:
- Preconditions: Observables that must be present for the activity to succeed
- Effects: Observables produced as a result of performing the activity, regardless of whether they are detected (Example: A reaction produces chlorine, but a mechanism is used to remove the chlorine from the waste stream. Chlorine is still called out as an effect.)
- Incidentals: Observables that are not absolutely required for an activity but are likely to be present given what is typically used to conduct the activity (Example: In the chemistry domain, many reactions are carried out in a fume hood. The fume hood, while ideal for safety reasons, is not absolutely required and is therefore called out as incidental because it may or may not be present. If present, it does provide significant clues to the type of activities being conducted.)
Each observable contains the following information if available from a vetted source:
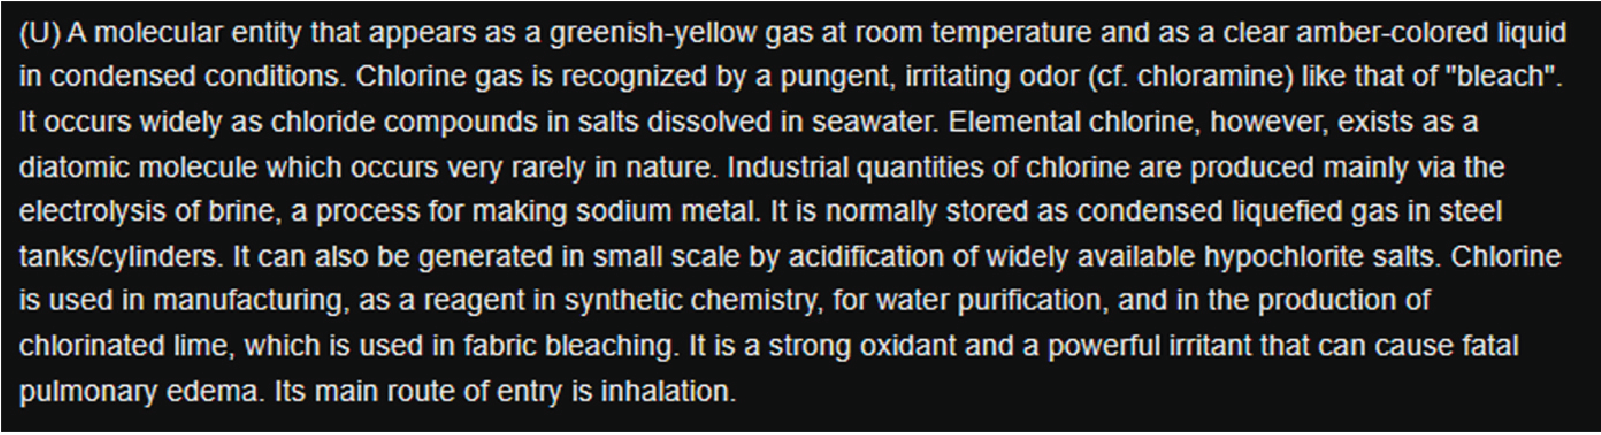
- Definition/description
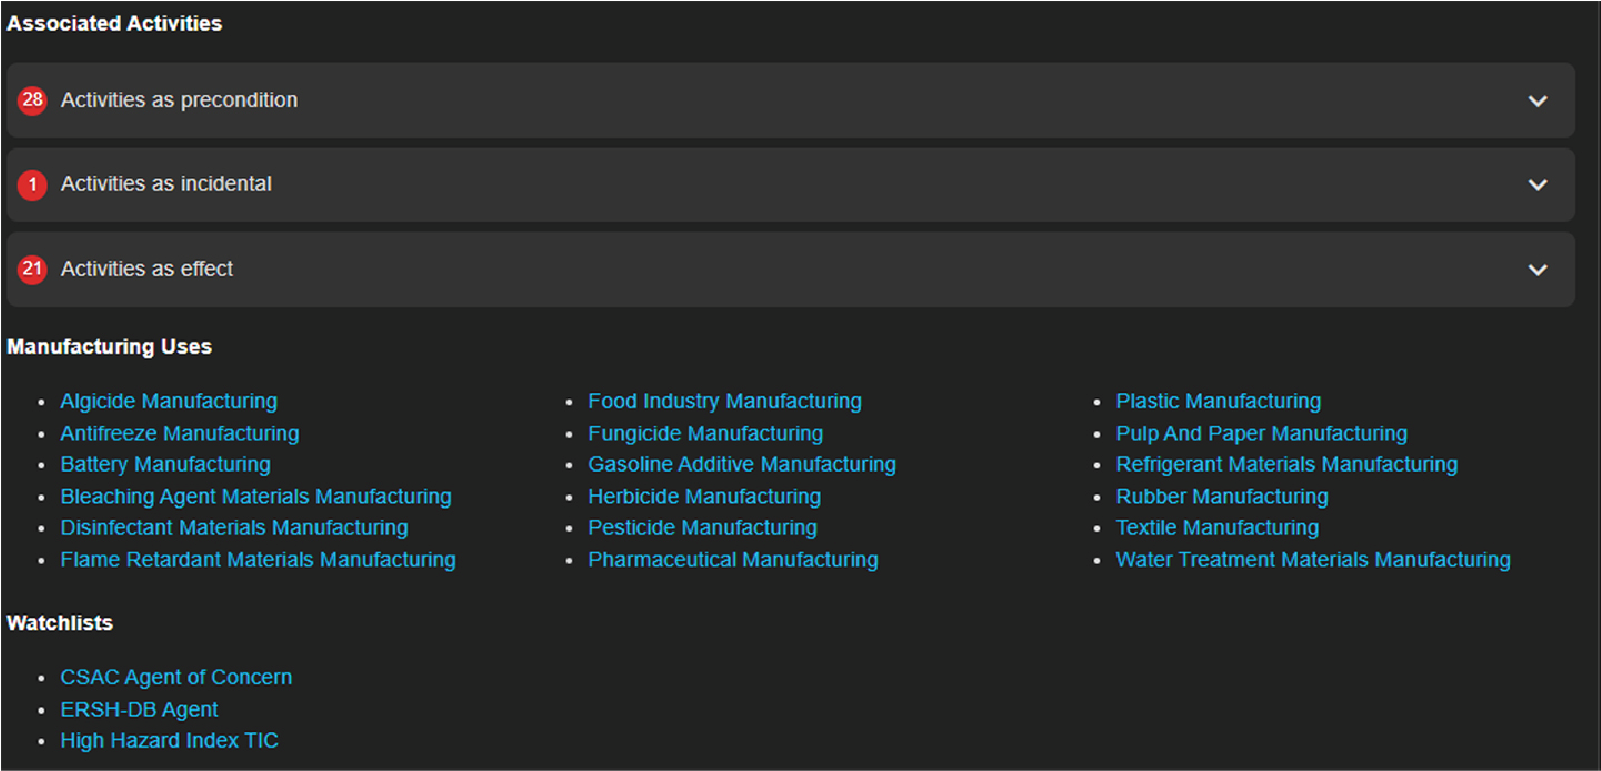
- Nefarious and legitimate manufacturing uses
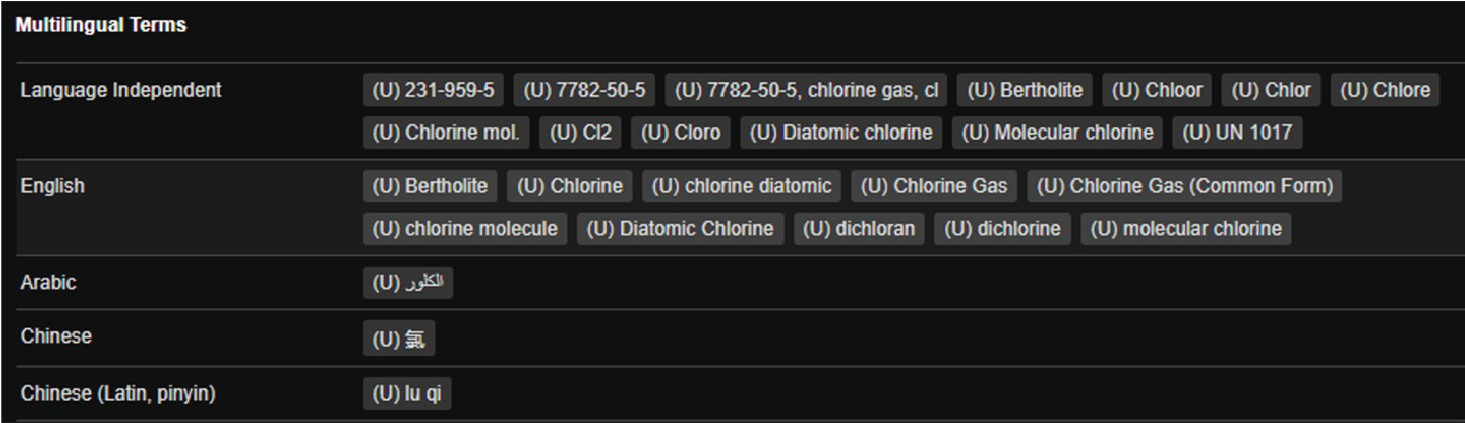
- English, foreign-language, and language-independent alternative labels, synonyms, and colloquialisms
- Description of entity relationships (e.g., potential uses)
- Classification
- Source information (e.g., bibliographic citations)
- Pictures/illustrations
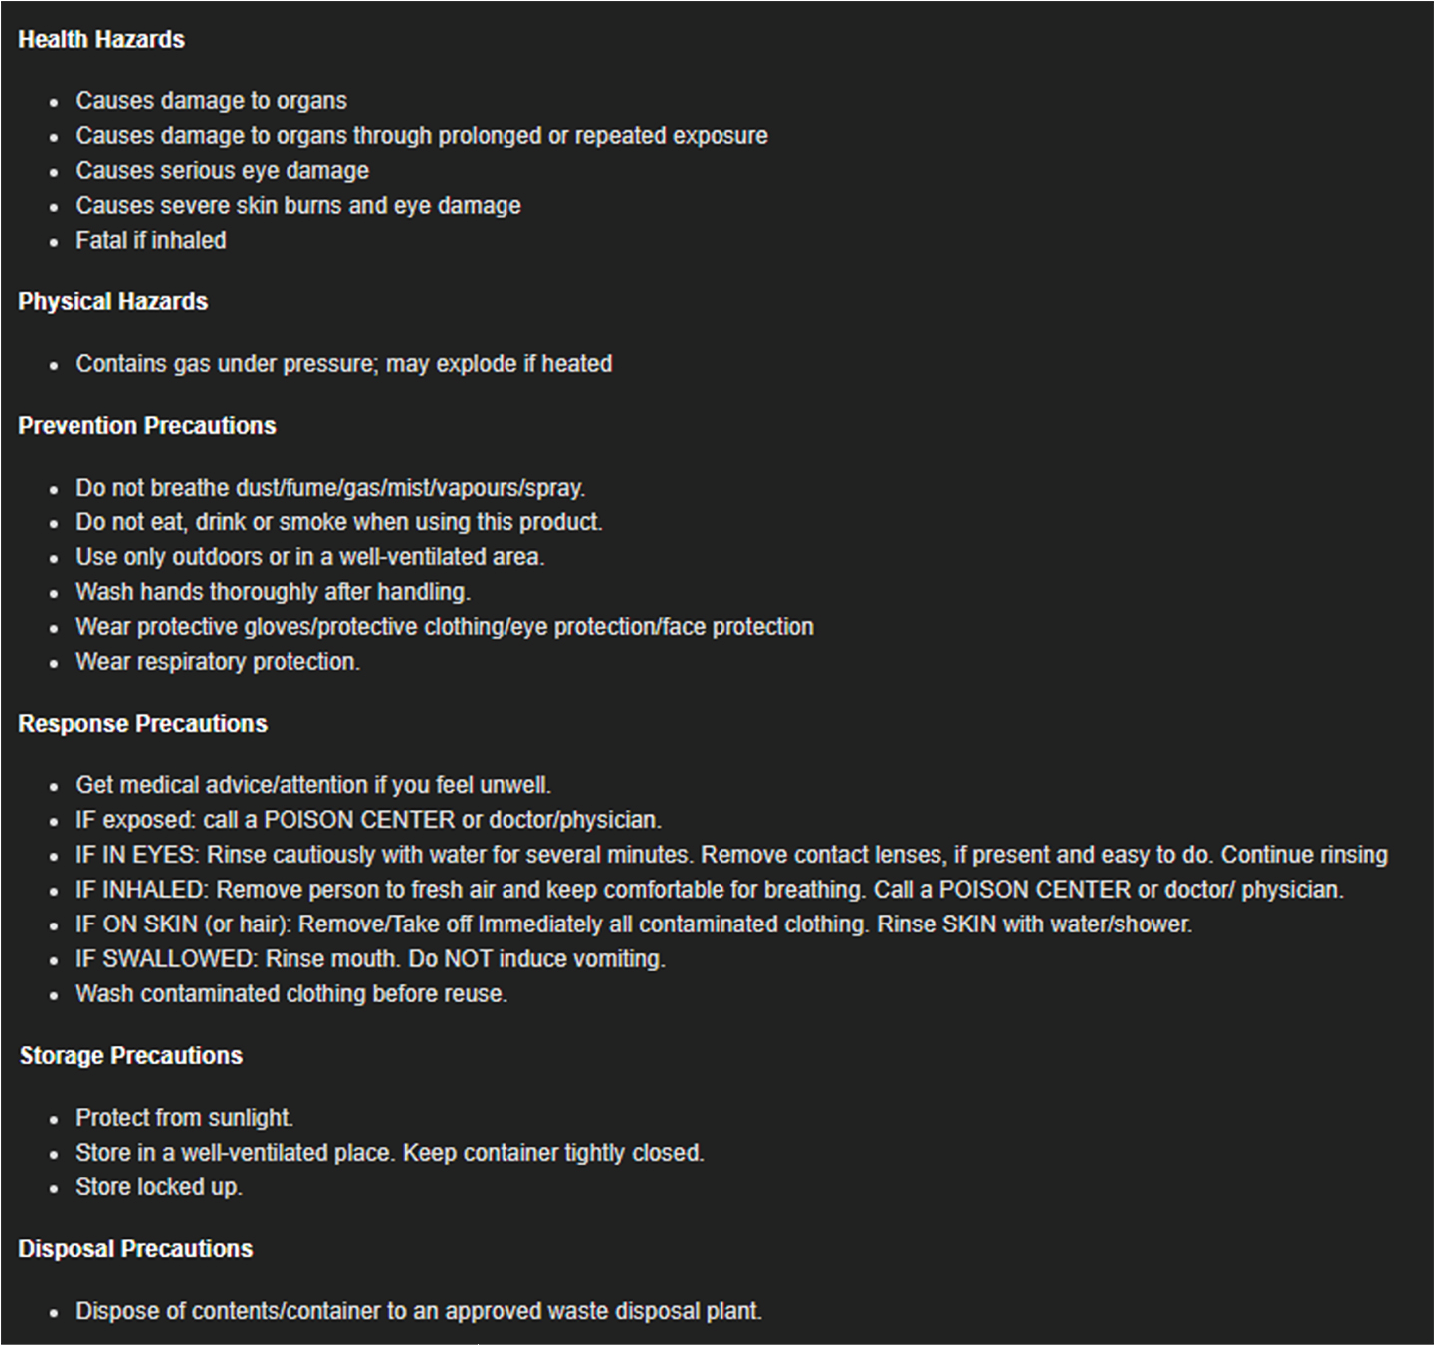
For biological and chemical entities, the following information is also included:
- Health and hazard statements, where appropriate
- Physical properties, where appropriate
- Industrial uses
- Cross-references to chemical and biological datasets
- Machine-readable identifiers (e.g., Chemical Abstract Service registry numbers)
Observables, like processes and activities, are modeled as instances of classes defined within ontologies tailored to specific CBRNE-SF domains. These ontologies are built using the Resource Description Framework (RDF) and the Web Ontology Language (OWL), standards endorsed by the World Wide Web Consortium (W3C).2,3 RDF structures data as a graph composed of subject–predicate–object triples, each expressing a simple fact (e.g., Bill isFatherOf Steve). These statements are linked to form dynamically growing graphs, enabling rich semantic modeling, inference, and graph analytics, capabilities particularly well suited for representing adversarial activity.
To enhance semantic precision and structure, RDF is extended through RDF Schema (RDFS) and OWL, which introduce class- and property-based constructs for building ontologies. In this framework, classes define conceptual entities, and properties express the relationships among them, together forming a flexible, machine-readable vocabulary for each domain of interest.
The CBRNE-SF knowledge base is fundamentally a composition of such ontologies. These are not limited to taxonomic hierarchies; rather, concepts can assert facts about other concepts, creating a richly interconnected semantic model. To ensure consistency and expressiveness across domains, the domain-specific ontologies are aligned under foundational upper ontologies. These upper ontologies provide additional structure and rigor to the knowledge representation, though their detailed description lies beyond the scope of this overview.
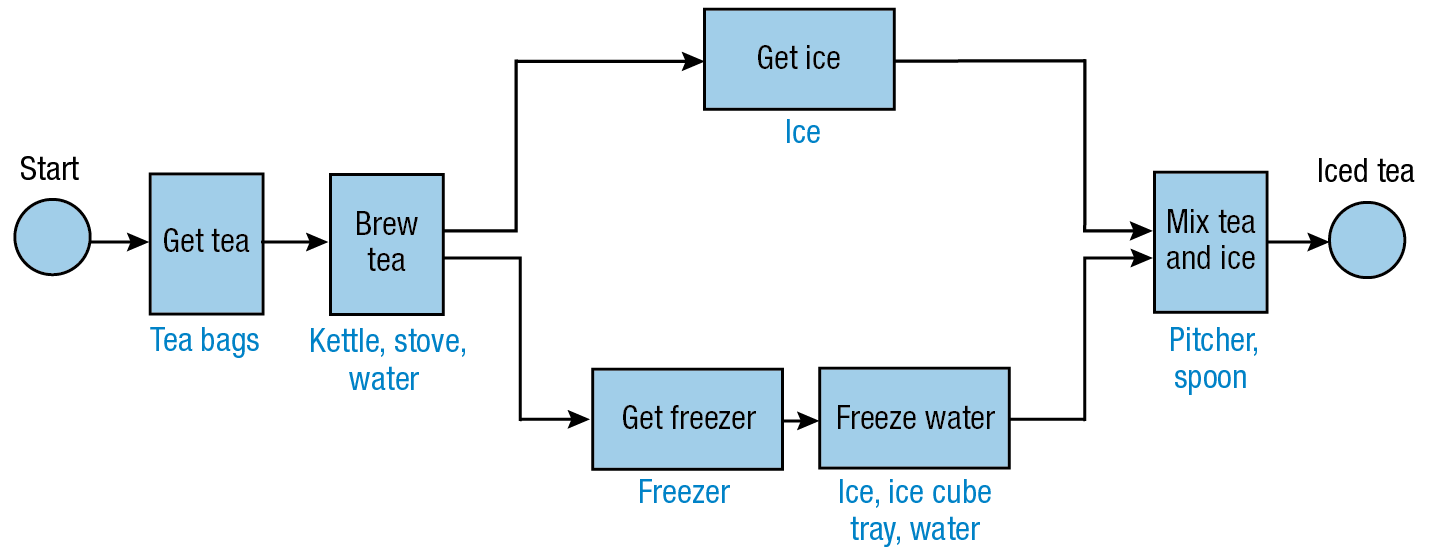
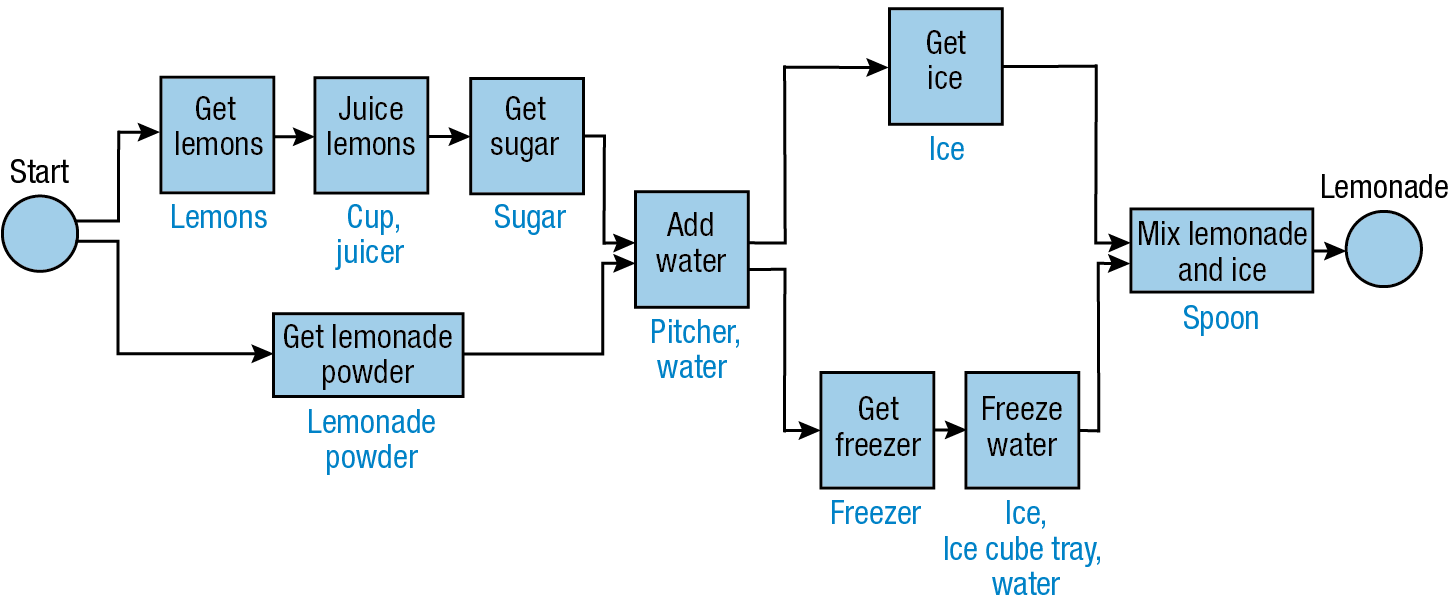
Combining processes, activities, observables and signatures for a single threat agent creates a complex data model that a human would have difficulty understanding as a whole. However, given the structure of the CBRNE-SF, the application interface allows a user to easily query the graph in real time to explore complex relationships among observables, activities, and processes for WMD production, weaponization, and employment. This interface provides deeper insights and more comprehensive answers to complex mission-critical questions. Figure 2 shows an example of a single threat pathway as an illustration of the scale and complexity of more than one hundred of these pathways modeled in the overall graph.
Figure 2
Example of a threat pathway within the broader knowledge graph and details of a specific activity.

Analytics Enabled by CBRNE-SF
A web application was developed to provide analysts with an interface to quickly retrieve, explore, and query the complex data enabling them to answer the most mission-relevant questions with ease. Several analytical workflows assist system users as they answer mission-critical questions about observables. For example:
- What is it?
- Basic definition
- Uses and regulations
- Exposure information
- Physical characteristics
- Alternative identification
- What can it be used for?
- Possible nefarious WMD production routes
- Possible non-nefarious industrial/commercial uses
- What else should I look for?
- A prioritized list of unique observables to guide further search activities
Given the machine-readable knowledge graph, queries are returned in real time and dynamically rendered on a web page. A user’s primary workflow involves searching for an observable and scrolling through the Details page. In another workflow, the user enters observables into the Evidence Bag and scrolls through the returned output. To give some insight to the information returned to an analyst, a few examples are provided below.
Observable Detail Page Workflow
The observables Details page varies slightly by the WMD threat type, but, in general, all Details pages contain similar information pulled dynamically from CBRNE-SF through queries that traverse the knowledge graph to retrieve the requested information. When accessing the Details page for a toxic industrial chemical (e.g., chlorine gas), the user will see a definition of the chemical, as shown in Figure 3. Definitions, typically written by a SME, provide basic information in an easy-to-understand paragraph. They are designed to be helpful to nonexperts and provide context for why the observable is part of a CWMD knowledge graph.
In the view shown in Figure 4, the user is presented with the activities associated with chlorine. These activities are separated by the function that chlorine plays in the activity (e.g., “Activity as precondition”). Chlorine is used in 28 activities as a precondition, indicating that while chlorine itself is toxic, it is also used as a precursor. Chlorine functions as an effect in 21 activities, indicating that there are 21 general ways to generate chlorine either as the intended product or as an incidental by-product. Chlorine functions in one activity as an incidental, indicating that it may or may not be present. While not shown in the figure, a user can expand each section to access a collapsible list of specific activities. The user can further click a link to a particular activity to see all of the content, such as activity definitions, images, durations, reference material, and bibliographic citations.
The CBRNE-SF also contains information on manufacturing uses, and similarly, if the observable is on any control lists, the lists will be provided in a dedicated section. If the user needs more information on other observables within a manufacturing industry or on a list, they simply need to click the linked text in the relevant section to view all of the observables in the CBRNE-SF with that industrial use or on that control list.
Information on uses and regulations allows the user to understand whether there are dual uses for the observable and whether there any restrictions on its use. This information provides critical context and situational awareness for the user.
Figure 3
Excerpt from the Details page for the chlorine gas observable.

Figure 4
Activities associated with chlorine.

Exposure Information
The application also dynamically displays exposure information in two sections of the Details page. The first section lists information extracted from safety data sheets, which are globally standardized documents detailing the harmful effects of chemical exposures. For all chemical threats and precursors included in the CBRNE-SF, such as chlorine, a safety data sheet was obtained and the information extracted. Figure 5 shows an example of the type of extracted information that is included for each chemical and biological precursor, when available.
Physical Properties
The scientific community and the US government have made considerable investments to understand physical properties of chemical and biological threat agents and precursors. Knowledge of these properties is critical for certain missions, such as modeling and simulating potential releases to assess consequences. Some of these data can be found in open sources, such as PubChem,4 while other data can be found only in restricted government reports. The web application provides the user with a single location to access both open-source data and US government-furnished data. Each data point has a button indicating where the data originated. For instance, Figure 6 displays the boiling point of chlorine, as obtained from PubChem.5
While the user can simply view the displayed values dynamically returned from the knowledge graph, it is also possible to create a custom query that traverses the CBRNE-SF to return all chemicals with a certain boiling property.
Alternative Identification
Language is complex, with multiple ways to refer to the same object. Chemicals can be described using system identifiers and multilingual terms. The CBRNE-SF contains all known system identifiers, such as the Chemical Abstracts Service (CAS) registration numbers and reference numbers for popular open-source databases, such as ChemSpider.6
Multilingual terms, like the ones in Figure 7 for chlorine, are typically extracted from data sources such as PubChem. All multilingual terms that are encoded for a given observable are also searchable. This allows the user to access information on an observable without needing to know the name used in the CBRNE-SF. As an example, each chemical in the CBRNE-SF has a unique URI with alternative label data semantically linked as a series of nodes and edges.
Figure 5
Example of the type of information extracted from a safety data sheet.

Figure 6
Example of physical property data from PubChem.

Figure 7
Example of multilingual terms in the CBRNE-SF.

Set Similarity Algorithm for Evidential Reasoning
A user is able to look for threat agent production processes associated with the set of entered observables. The application traverses the knowledge graph and presents a table of processes ordered by a calculated similarity score. In set theory, this similarity score is called a weighted Tversky index.7 Similarity scores are described in more detail below.
Algorithm Overview
Figure 8 summarizes the steps involved in the process-ranking algorithm.
The three sets described in step 4 are related to the overlap of the observed resources within an Evidence Bag and the resources within a given process. Given an evidence set E and process p, three sets of resources must be identified:
- The overlap set contains all of the resources that appear in E and either appear directly in p or are an instance of a resource that appears in p.
- The evidence-only set contains resources that are in E but are not in p.
- The process-only set contains resources that are in p but not in E.
These sets are illustrated in Figure 9.
In step 3, each resource r is given a weight Xr that is inversely related to its prevalence
\[
X_{r} = -\log\!\left(F_{r}\right) \text{,} \tag{1}
\]
where Fr is the resource’s prevalence (i.e., the proportion of processes in which r appears). This weight is equivalent to the resource’s “self-information.”8
Step 7 in the algorithm computes a similarity score for each process with respect to the observed evidence set. The similarity score for each process is computed as
\[
W_{p} = T_{\mathrm{OVERLAP}} \, / \left(T_{\mathrm{OVERLAP}} + \alpha \ast T_{\mathrm{EVIDENCE\mbox{-}ONLY}} + \\
\beta \ast T_{\mathrm{PROCESS\mbox{-}ONLY}}\right)
\text{.} \tag{2}
\]
In Eq. 2, parameter α determines the size of the penalty for resources from the evidence set that do not appear in process p. Parameter β determines the size of the penalty for resources in p that were not recorded within the evidence set.
The process with the greatest similarity score is ranked the highest and can be considered the most likely. The score for each process is determined from the scores of the resources within that process, the scores of the resources within the given set of evidence, and the extent to which these sets of resources overlap.
Figure 8
Steps involved in the process-ranking algorithm.

Figure 9
Sets of resources.

Example Computations
To demonstrate the evidence algorithm, consider the following example for making iced tea, lemonade, and orange juice. Figures 10 and 11 each contain a single process, as does Figure 1 shown earlier. Blue boxes indicate activity nodes, and blue type outside the boxes describes resources used in the activities. In this example, α and β are both set to 0.5, suggesting that it is equally important for a resource to be missing from the Evidence Bag or from a process.
Figure 10
Iced tea process example.

Figure 11
Lemonade process example.

Each time evidence is collected, the observables are compared with the resources in each process, and a corresponding score is assigned to each process. The steps enumerated below correspond to the algorithm description in Figure 8.
- Evidence set = {cup, ice cube tray, pitcher, sugar}.
- Steps 1 and 2: The resources within this evidence set overlap with the iced tea, lemonade, and orange juice processes. Therefore, weights must be calculated for all resources in these processes.
- Step 3: Table 1 provides the weights for each resource that appears in at least one process. If a resource appears in one of three processes, its weight is –log(1/3) = 1.097. Similarly, if a resource appears in two of three processes, its weight is –log(2/3) = 0.405. If a resource appears in all three processes, its weight is –log(3/3) = –log(1) = 0.
- Step 4: The resources that appear in the evidence are compared separately with each process.
- For the iced tea process, the resources that appear both in the evidence set and the process (overlap set) are {cup, ice cube tray, pitcher}. The resources that appear in the evidence but not in the iced tea process (evidence-only set) are {sugar}. The resources that appear in the iced tea process but not in the evidence (process-only set) are {freezer, ice, kettle, spoon, stove, tea bags, water}.
- For the lemonade process, the overlap set is {cup, ice cube tray, pitcher, sugar}; the evidence-only set is the empty set (i.e., there are no resources in this set); and the process-only set is {freezer, ice, juicer, lemonade powder, lemons, spoon, water}.
- For the orange juice process, the overlap set is {pitcher}; the evidence-only set is {cup, ice cube tray, sugar}; and the process-only set is {juicer, orange juice concentrate, oranges, water}.
- Step 5: Table 2 provides the total weight for each set. These totals are obtained from the sum of the weights of the resources in each set. For instance, the weight for the overlap set in the iced tea process is 1.097 (cup) + 0.405 (ice cube tray) + 0 (pitcher) = 1.502. Since the pitcher resource appears in all three processes, its weight is 0 (i.e., it does not provide any information on which process is most similar to be active).
- Step 6: Given α = β = 0.5, the similarity scores for each process are calculated as follows:
- WIT = 1.502/(1.502 + 0.5*1.097 + 0.5*4.180) = 0.363
- WLM = 2.599/(2.599 + 0.5*0 + 0.5*3.527) = 0.596
- WOJ = 0/(0 + 0.5*2.599 + 0.5*2.635) = 0
- Step 7: WLM = 0.596 is greater than WIT or WOJ (i.e., the lemonade process has the greatest similarity score). Therefore, the lemonade process is identified as the most similar.
Table 1. Weights by resource for example | |||||
Resource | Appears In | Resource Prevalence | Weight | ||
Iced Tea Process | Lemonade Process | Orange Juice Process | |||
Cup | ✓ | 1/3 | 1.097 | ||
Freezer | ✓ | ✓ | 2/3 | 0.405 | |
Ice | ✓ | ✓ | 2/3 | 0.405 | |
Ice cube tray | ✓ | ✓ | 2/3 | 0.405 | |
Juicer | ✓ | ✓ | 2/3 | 0.405 | |
Kettle | ✓ | 1/3 | 1.097 | ||
Lemonade powder | ✓ | 1/3 | 1.097 | ||
Lemons | ✓ | 1/3 | 1.097 | ||
Orange juice concentrate | ✓ | 1/3 | 1.097 | ||
Oranges | ✓ | 1/3 | 1.097 | ||
Pitcher | ✓ | ✓ | ✓ | 3/3 | 0 |
Spoon | ✓ | ✓ | ✓ | 3/3 | 0 |
Stove | ✓ | 1/3 | 1.097 | ||
Sugar | ✓ | 1/3 | 1.097 | ||
Tea bags | ✓ | 1/3 | 1.097 | ||
Water | ✓ | ✓ | ✓ | 3/3 | 0 |
Table 2. Weights for each set (from example 1) | |||
Process | Set | ||
Overlap | Evidence-Only | Process-Only | |
Iced tea | 1.502 | 1.097 | 4.180 |
Lemonade | 2.599 | 0 | 3.527 |
Orange juice | 0 | 2.599 | 2.635 |
Conclusion
APL has worked with the US government for more than 15 years to create the most comprehensive set of CBRNE ontologies to enable CWMD missions worldwide. As a machine-readable representation of reality, the CBRNE-SF is continuing its evolution as a shared CWMD resource. It is poised to support next-generation generative artificial intelligence and large language model capability. The CBRNE-SF has contributed to DTRA’s position as a locus of authority for CBRNE ontologies, enabling tighter integration of and interoperability within the broader US government CWMD mission space.
- Object Management Group, “What is UML?” https://www.uml.org/what-is-uml.htm (accessed Jun. 23, 2025).
- World Wide Web Consortium (W3C), “RDF 1.1 primer,” W3C Working Group Note, Jun. 24, 2014, https://www.w3.org/TR/rdf-primer.
- World Wide Web Consortium (W3C), “RDF 1.2 schema,” W3C Working Draft, Jun. 13. 2025, https://www.w3.org/TR/rdf12-schema.
- National Library of Medicine, PubChem, https://pubchem.ncbi.nlm.nih.gov/ (accessed Jun. 23, 2025).
- S. Kim, J. Chen, T. Cheng, A. Gindulyte, J. He, et al. “PubChem 2025 update,” Nucleic Acids Res., vol. 53, no. D1, pp. D1516–D1525, 2025, https://doi.org/10.1093/nar/gkae1059.
- H. E. Pence and A. Williams, “ChemSpider: An online chemical information resource,” J. Chem. Educ., vol. 87, no. 11, pp. 1123–1124, 2010, https://doi.org/10.1021/ed100697w.
- C. Gao, H. Ye, F. Cao, C. Wen, Q. Zhang, and F. Zhang, “Multiscale fused network with additive channel–spatial attention for image segmentation,” Knowl.-Based Syst., vol. 214, art. 106754, 2021, https://doi.org/10.1016/j.knosys.2021.106754.
- G. Katona and O. Nemetz, “Huffman codes and self-information,” IEEE Trans. Inf. Theory, vol. 22, no. 3, pp. 337–340, 1976, https://doi.org/10.1109/TIT.1976.1055554.
Ray H. Mariner is a program manager in APL’s Homeland Defense Mission Area. He has a B.S. in chemistry from Loyola College in Maryland (now Loyola University Maryland) and an M.S. in homeland security management from the University of Maryland Global Campus. Ray has more than 25 years of experience as an analytical chemist and data scientist, and other areas of expertise include semantic modeling, threat modeling, and threat prioritization.
Timothy P. Lippa is the head of APL’s Electromagnetic Sensing Systems Branch. He holds a B.S. in chemistry from Loyola University and an M.S. and a Ph.D. in chemistry from Johns Hopkins University. He leads three technical groups and has led a broad portfolio of technical projects focused primarily on countering the proliferation and use of chemical warfare agents. His work includes the development of chemical sensors, integrated sensing systems, and sensor test beds. He has also collaborated with computer scientists to merge natural sciences with data science, producing software systems that enhance understanding of potential adversarial threats and inform methods to counter them.
Phillip T. Koshute is a data scientist and statistical modeler in APL’s Asymmetric Operations Sector. He earned a B.S. in mathematics from Case Western Reserve University and an M.S. in operations research from North Carolina State University. He is pursuing a Ph.D. in applied statistics at the University of Maryland. He provides statistical expertise to data science projects with a wide range of applications, including biology, chemistry, and additive manufacturing.
David W. Boyce is physical and material scientist in APL’s Asymmetric Operations Sector. He has a B.S. in chemistry from Villanova University and an M.S. and Ph.D. in chemistry from the University of Minnesota. David’s primary interests include creating models and multi-domain ontologies to support counter–weapons of mass destruction data science applications. He has experience in synthetic techniques, catalysis, and spectroscopy.
Josef C. Behling is the program area manager of APL’s Counter CBRNE Program Area. He has a B.S. in operations and information systems management from Pennsylvania State University and an M.S. in computer science from American University. He has expertise in melding software engineering, knowledge representation, natural science, and machine learning. As research lead, Joe shapes, communicates, and assesses cutting-edge research in natural science, sensing, artificial intelligence, autonomy, and data analytics for the counter–weapons of mass destruction mission. He is chair of the Department of Defense/Intelligence Community Ontology Working Group and the Internationalized Resource Identifier (IRI) Naming and Resolution Committee and is APL’s advisory committee representative to the World Wide Web Consortium (W3C).
Michael J. Peters is a senior software engineer and data scientist as well as the assistant supervisor of APL’s Threat Analytics Systems Group. He has a B.S. in computer science from Pennsylvania State University and an M.S. in computer science from Johns Hopkins University. Michael’s research interests include software design, applied machine learning, ontologies, and distributed software architectures.